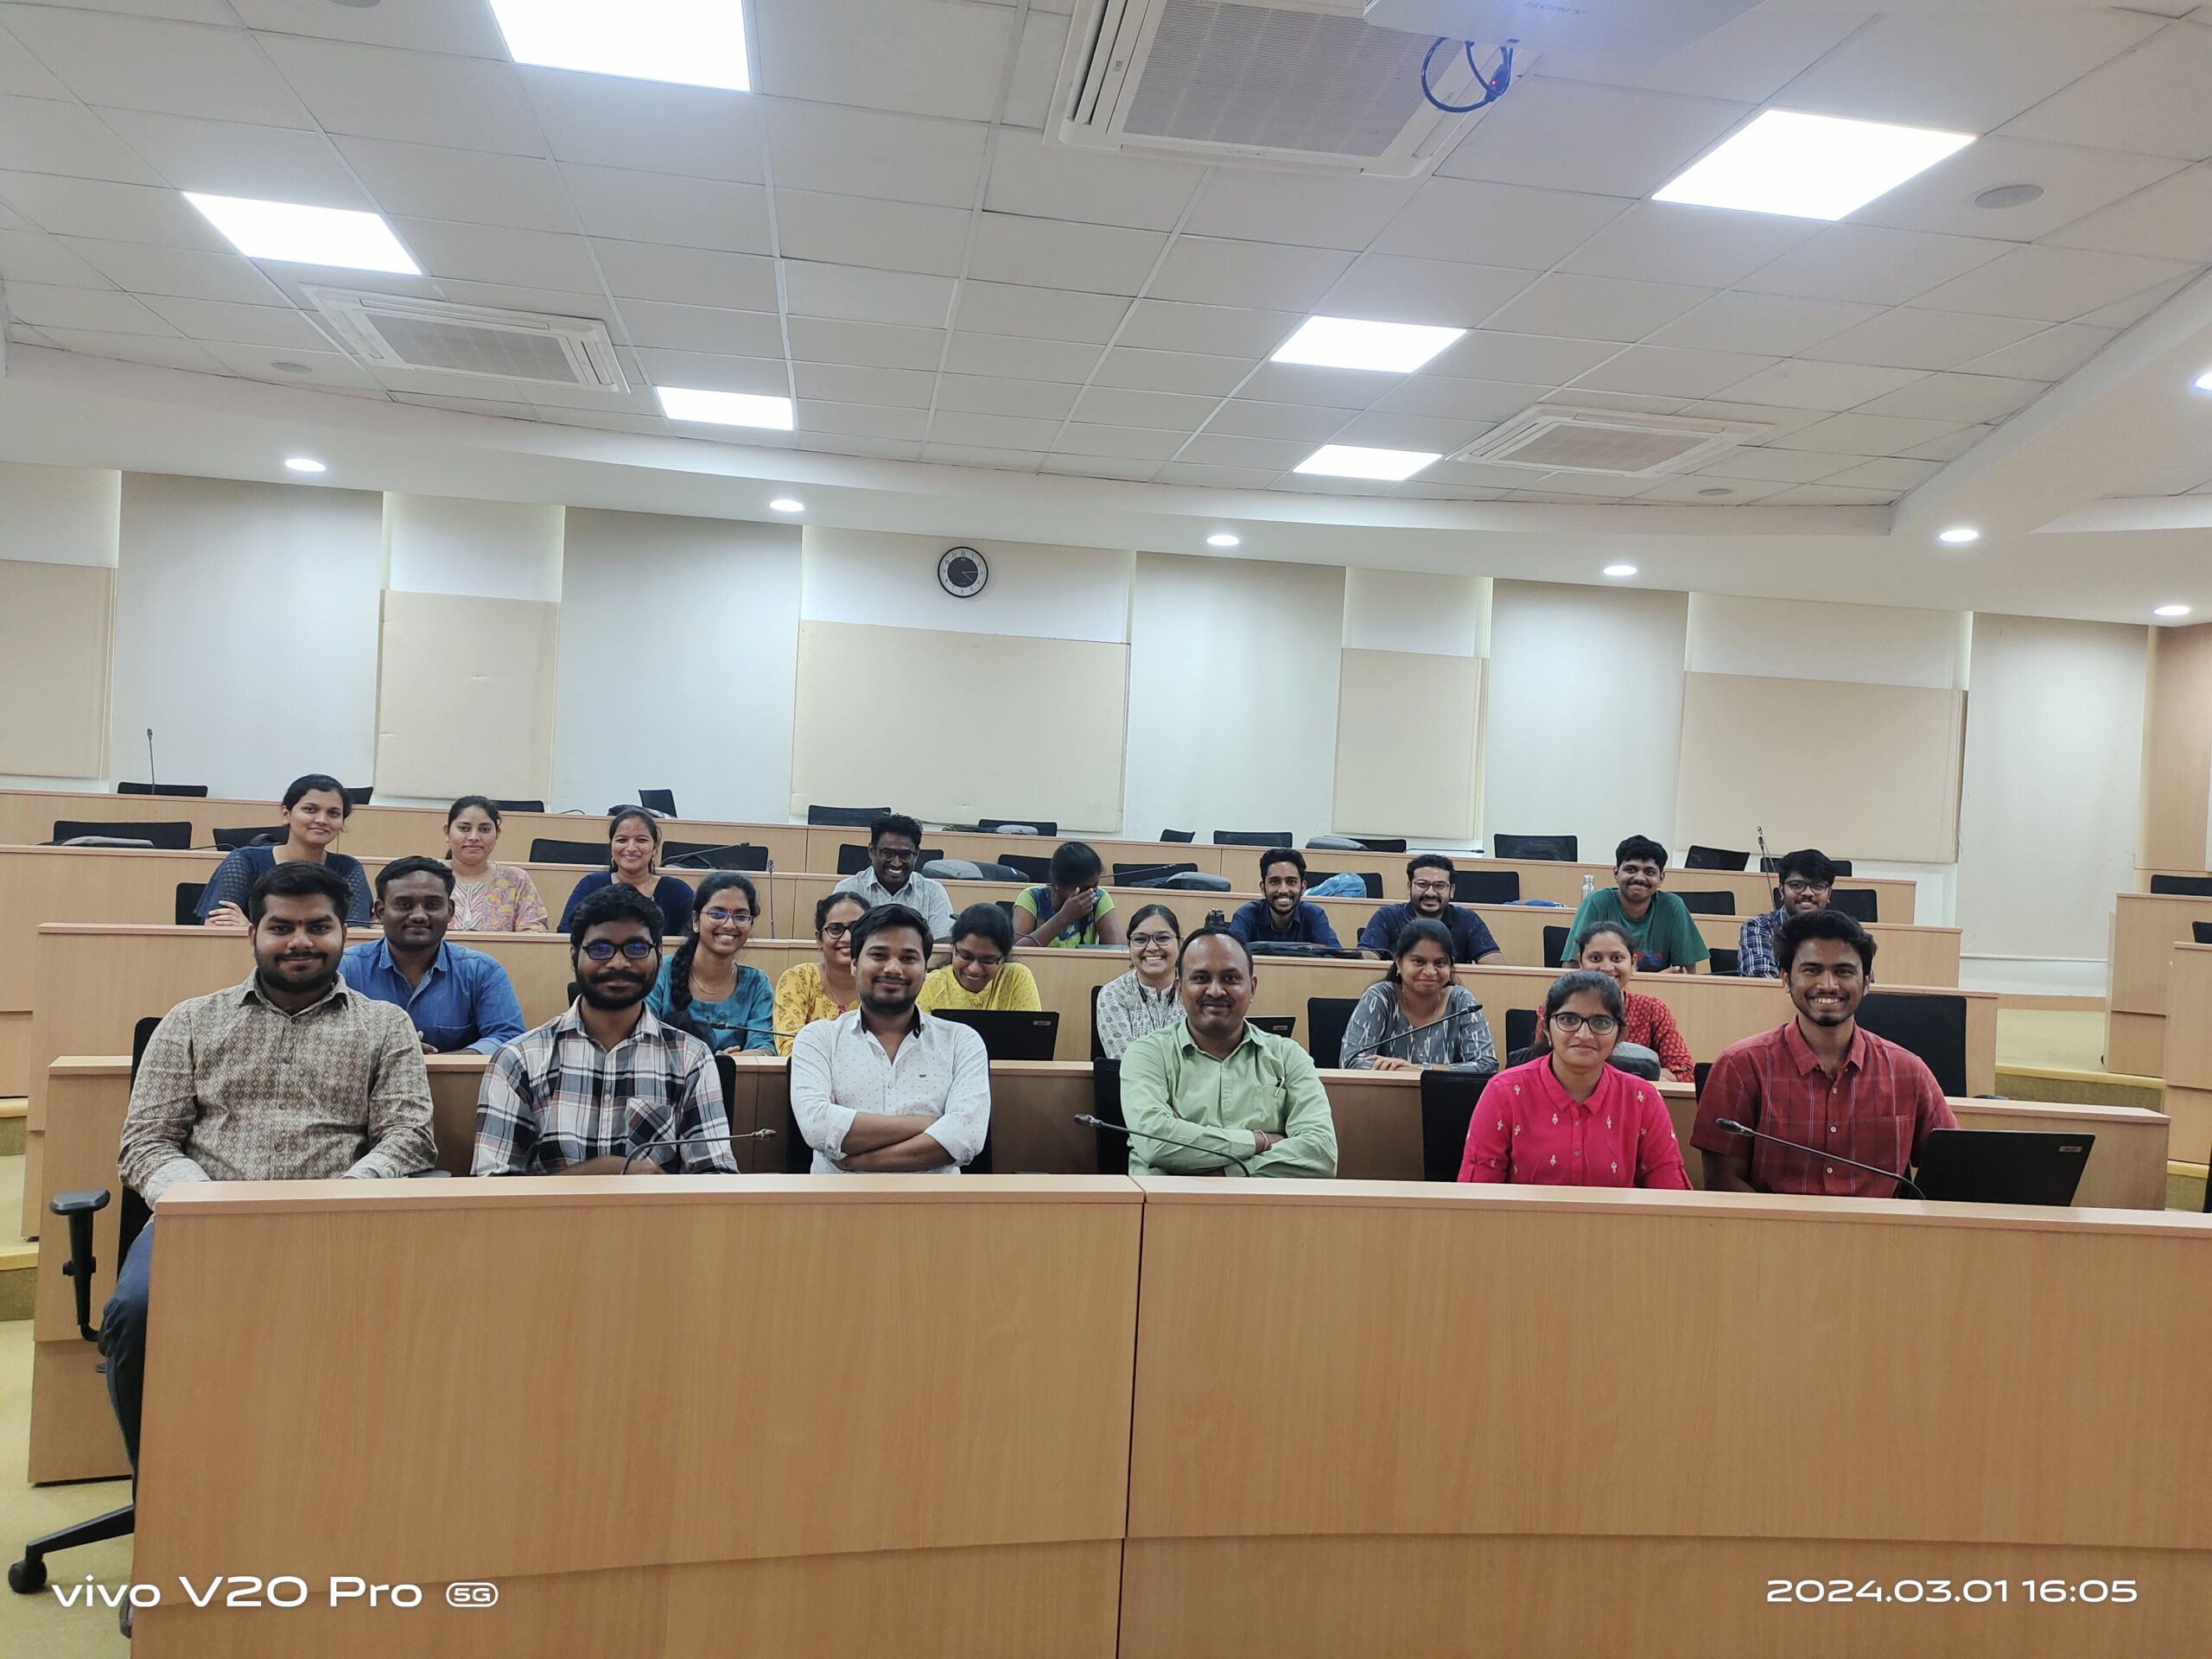
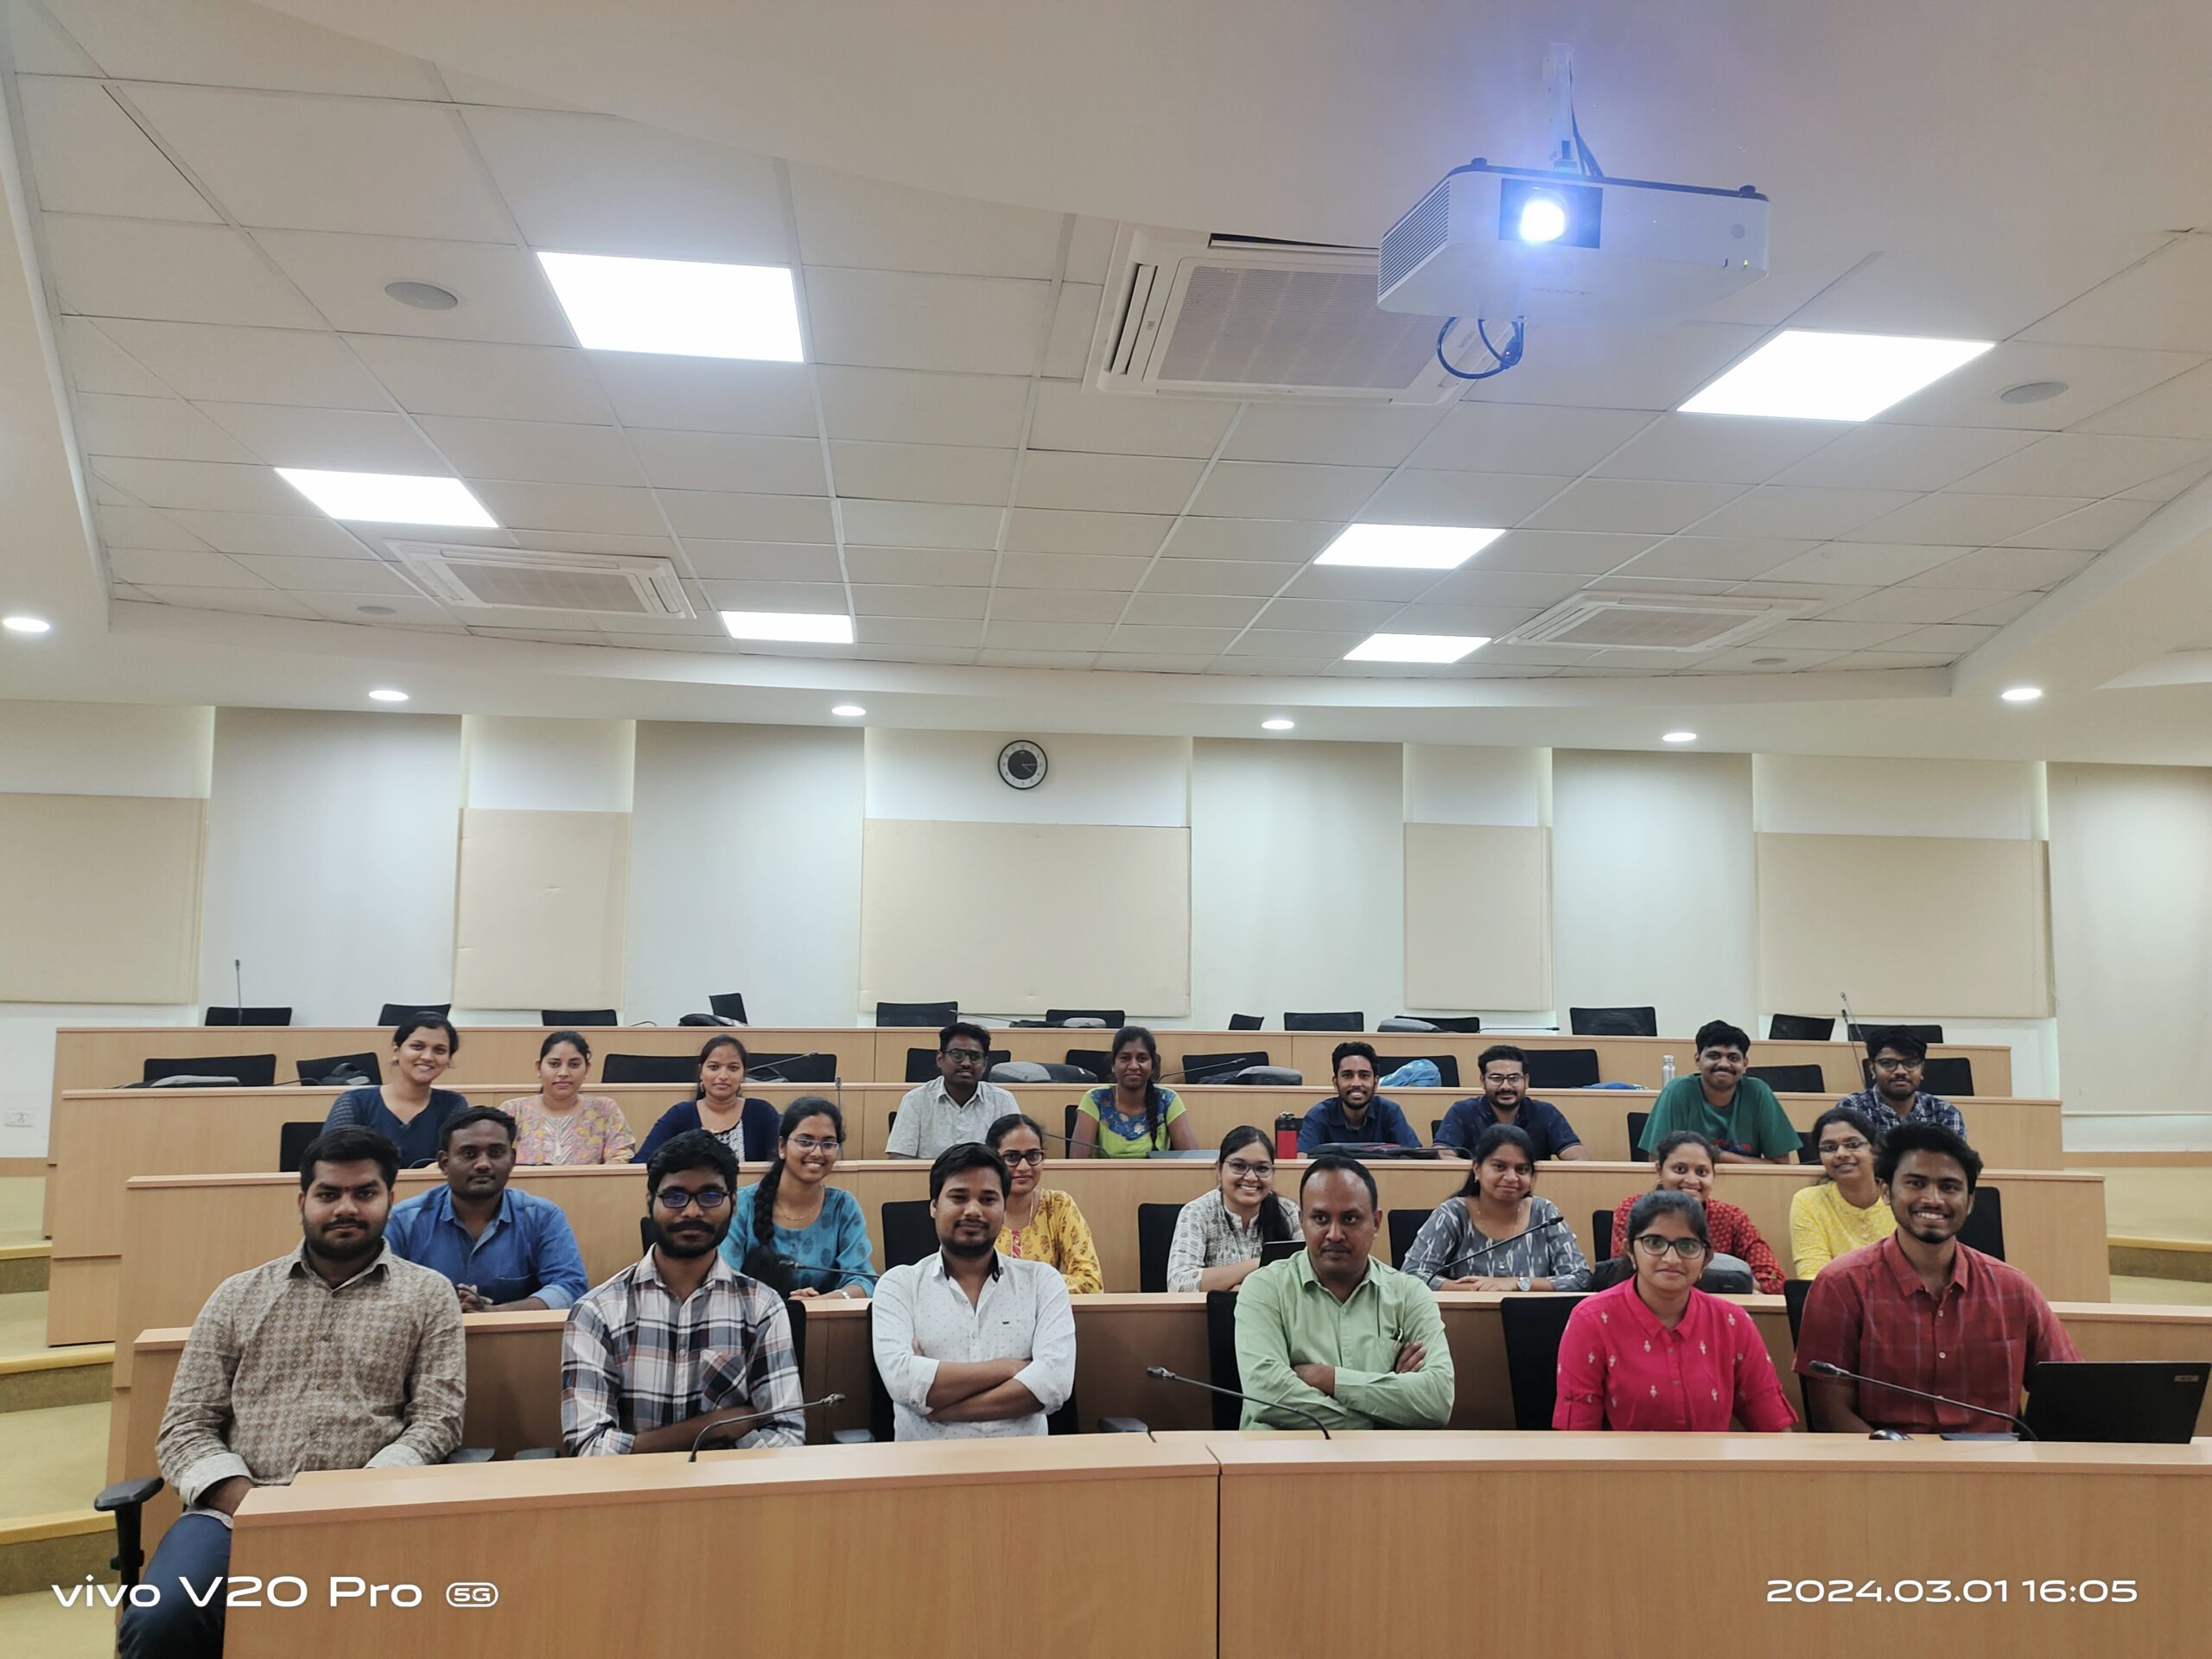
The Institute of Public Enterprise (IPE) recently hosted an intensive workshop titled “Data Visualization using Tableau” on March 1, 2024, tailored for the students of the 2022–2024 batch. This workshop aimed to enhance students’ practical skills in data visualization and storytelling with data, equipping them with essential tools and techniques that are invaluable in today’s data-driven world. The session saw enthusiastic participation, with 45 students enrolling to learn and understand the significance of data visualization in both academia and industry settings.
Workshop Objective and Importance
The primary objective of the workshop was to familiarize students with the powerful data visualization tool, Tableau. With businesses and organizations increasingly relying on data insights for decision-making, proficiency in tools like Tableau has become a sought-after skill. Data visualization is a critical component of data analytics, as it helps transform raw data into visually compelling narratives that make complex information more accessible and understandable. This workshop provided hands-on experience in crafting these visual narratives, thereby preparing students to present data in ways that can influence and inform key decisions in various fields, from business strategy to policy formulation.
The choice of Tableau for this workshop was strategic; it is one of the most popular and user-friendly platforms for data visualization, favored for its ability to handle large datasets, create interactive dashboards, and offer versatile charting options. The students learned how to utilize Tableau’s features to convert complex datasets into clear, visually appealing insights that are easy for stakeholders to understand.
Key Highlights of the Workshop
The inaugural session commenced at 10:00 a.m., beginning with a comprehensive overview of data visualization’s role in today’s data-centric landscape. Faculty and industry experts addressed the attendees, highlighting the importance of data visualization skills in various sectors, including finance, healthcare, marketing, and governance. This orientation helped students appreciate the relevance of Tableau in analyzing and presenting data across different industries.
Following the introductory session, the workshop transitioned into hands-on training, where students worked directly with Tableau. Key aspects of Tableau covered included:
- Data Connectivity – Students learned how to connect Tableau with various data sources, preparing them to handle diverse datasets in real-world scenarios.
- Chart Creation – Attendees explored different types of charts, including bar charts, line graphs, pie charts, and heat maps, and learned how to choose the appropriate visualization based on the type of data and insights required.
- Dashboard Development – One of the core skills introduced was creating interactive dashboards. Students were shown how to assemble multiple visualizations into a cohesive dashboard, facilitating a more comprehensive view of data insights.
- Data Storytelling – Students learned techniques for translating data insights into compelling stories, a skill that allows data analysts to highlight key trends and findings in ways that resonate with audiences.
- Filtering and Sorting Data – The workshop also covered data refinement techniques, such as filtering and sorting, allowing participants to focus on specific aspects of the data relevant to their analysis.
Benefits to Participants
The hands-on nature of the workshop ensured that students gained practical experience, and by the end of the day, each student had created a functional, insightful Tableau dashboard. The workshop also encouraged participants to think critically about data interpretation, to question patterns, and to present data with clarity and precision.
Moreover, this training aligns closely with the skill sets demanded in various sectors. Proficiency in Tableau, coupled with the ability to interpret data visually, enables students to add immediate value to future internships, projects, or careers. It fosters a mindset that emphasizes clarity and analytical depth when addressing complex datasets, which is crucial in areas like financial analysis, public policy evaluation, market research, and operational management.
Future Implications
For the Institute of Public Enterprise, hosting workshops like “Data Visualization using Tableau” underscores its commitment to providing industry-relevant education. By equipping students with practical, employable skills, IPE prepares them for a dynamic job market that increasingly relies on data-driven decision-making.
This successful workshop not only introduced students to the fundamentals of Tableau but also reinforced the importance of data visualization in enabling informed decisions across disciplines. As data continues to shape the modern world, IPE’s focus on data-centric training ensures that its graduates remain competitive and well-prepared for future challenges in a range of industries.


